The strong connection between gender equality and a kickass national women’s soccer team
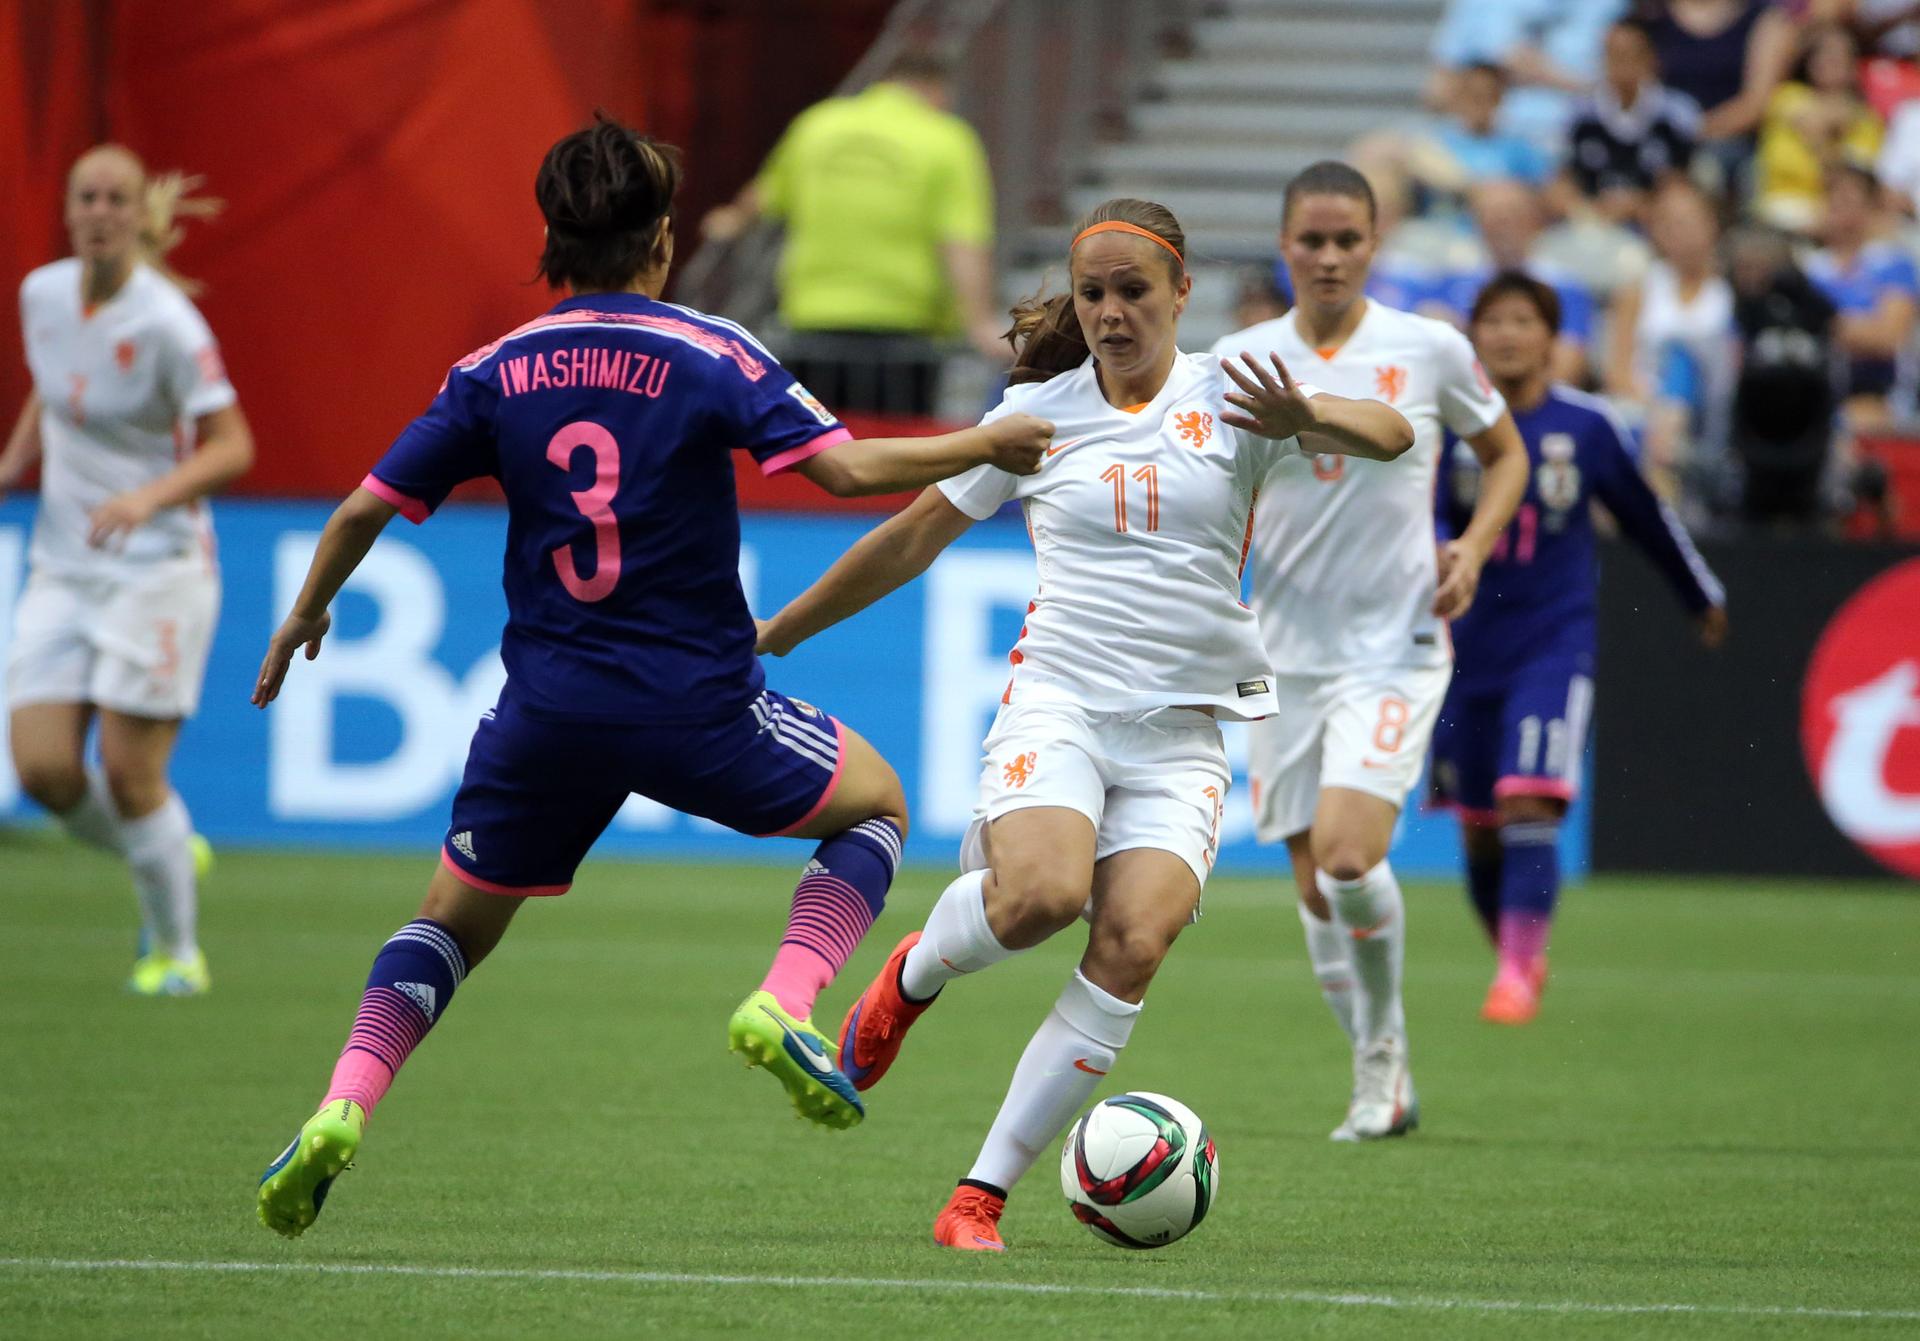
Netherlands forward Lieke Martens (11) controls the ball against Japan defender Azusa Iwashimizu (3) during the second half in the round of sixteen in the FIFA 2015 women’s World Cup soccer tournament at BC Place Stadium.
Want to have a kickass women’s national soccer team? Fix your gender inequality.
What are the common things shared by the top 23 teams in FIFA Women’s World Cup 2015 (top chart)? All of them are from countries where soccer is a popular sport, and most of them are from countries with a high Gross Domestic Product. Right. What else?
They are also from countries where the gender gap is smaller. We compared the latest FIFA points (which determine the world ranking) of each of the 23 qualified teams (Nigeria excluded) in the Women’s World Cup this year and the 2013 Gender Inequality Index (GII) of their countries, and found an interesting correlation between the two quantities.
Note: Nigeria was not plotted in the chart above as its GII value is not available.
The GII is developed by the United Nations to gauge how well women are doing in a country compared to men. The index measures gender inequalities in three aspects:
1. Reproductive health measured by maternal mortality ratio and adolescent birth rates;
2. Empowerment, measured by proportion of parliamentary seats occupied by females and proportion of adult men and women 25 years and older with at least some secondary education; and
3. Economic status expressed as labor market participation and measured by labor force participation rate of men and women 15 years and older.
The GII values range from 0 to 100 percent. The higher the value, the more disparities between females and males. The FIFA points were calculated based on match results and the latest data used here was updated on Mar 27. The chart clearly shows top teams that scored above 1,800 points are from countries with gender disparities below 30 percent. Countries with bigger gender disparities all ended up in the bottom left quarter of the chart.
There is one exception — Brazil. It is the only team from a country with higher GII (44 percent) but still secured a high position in FIFA Women’s World Ranking. The country known for producing some of the world’s greatest soccer players of both genders was able to beat the trend probably due to football being the most popular sports in Brazil.
However, gender disparities in Brazil are evident in soccer. Women were banned from playing soccer from 1941 to 1979 because the law stated that soccer is incompatible with the female nature. Until today, there is no national league for women’s soccer.
Besides gender inequalities, there is also another factor at play here. The size of the bubbles on the chart represents GDP per capita (current USD). Most high-ranking teams in the top right quarter of the chart are from high-income economies. The only exception is China.
Cha-ching! Of course, money matters.
However, if we plot all 126 teams in FIFA Women’s World Ranking of which their countries’ GDP data is available in one chart, and plot all 115 teams in the same ranking of which their countries’ GII is available in another chart, it is clear that gender disparity has a stronger effect on their ranking than GDP.
So, support your local women’s movement and you might find more reasons to root for your women’s national soccer team in the next World Cup.
Or even this World Cup: The US national squad defeated Germany 2-0 on Tuesday night and will face the winner of Wednesday's England-Japan match in the finals this weekend in Vancouver.
