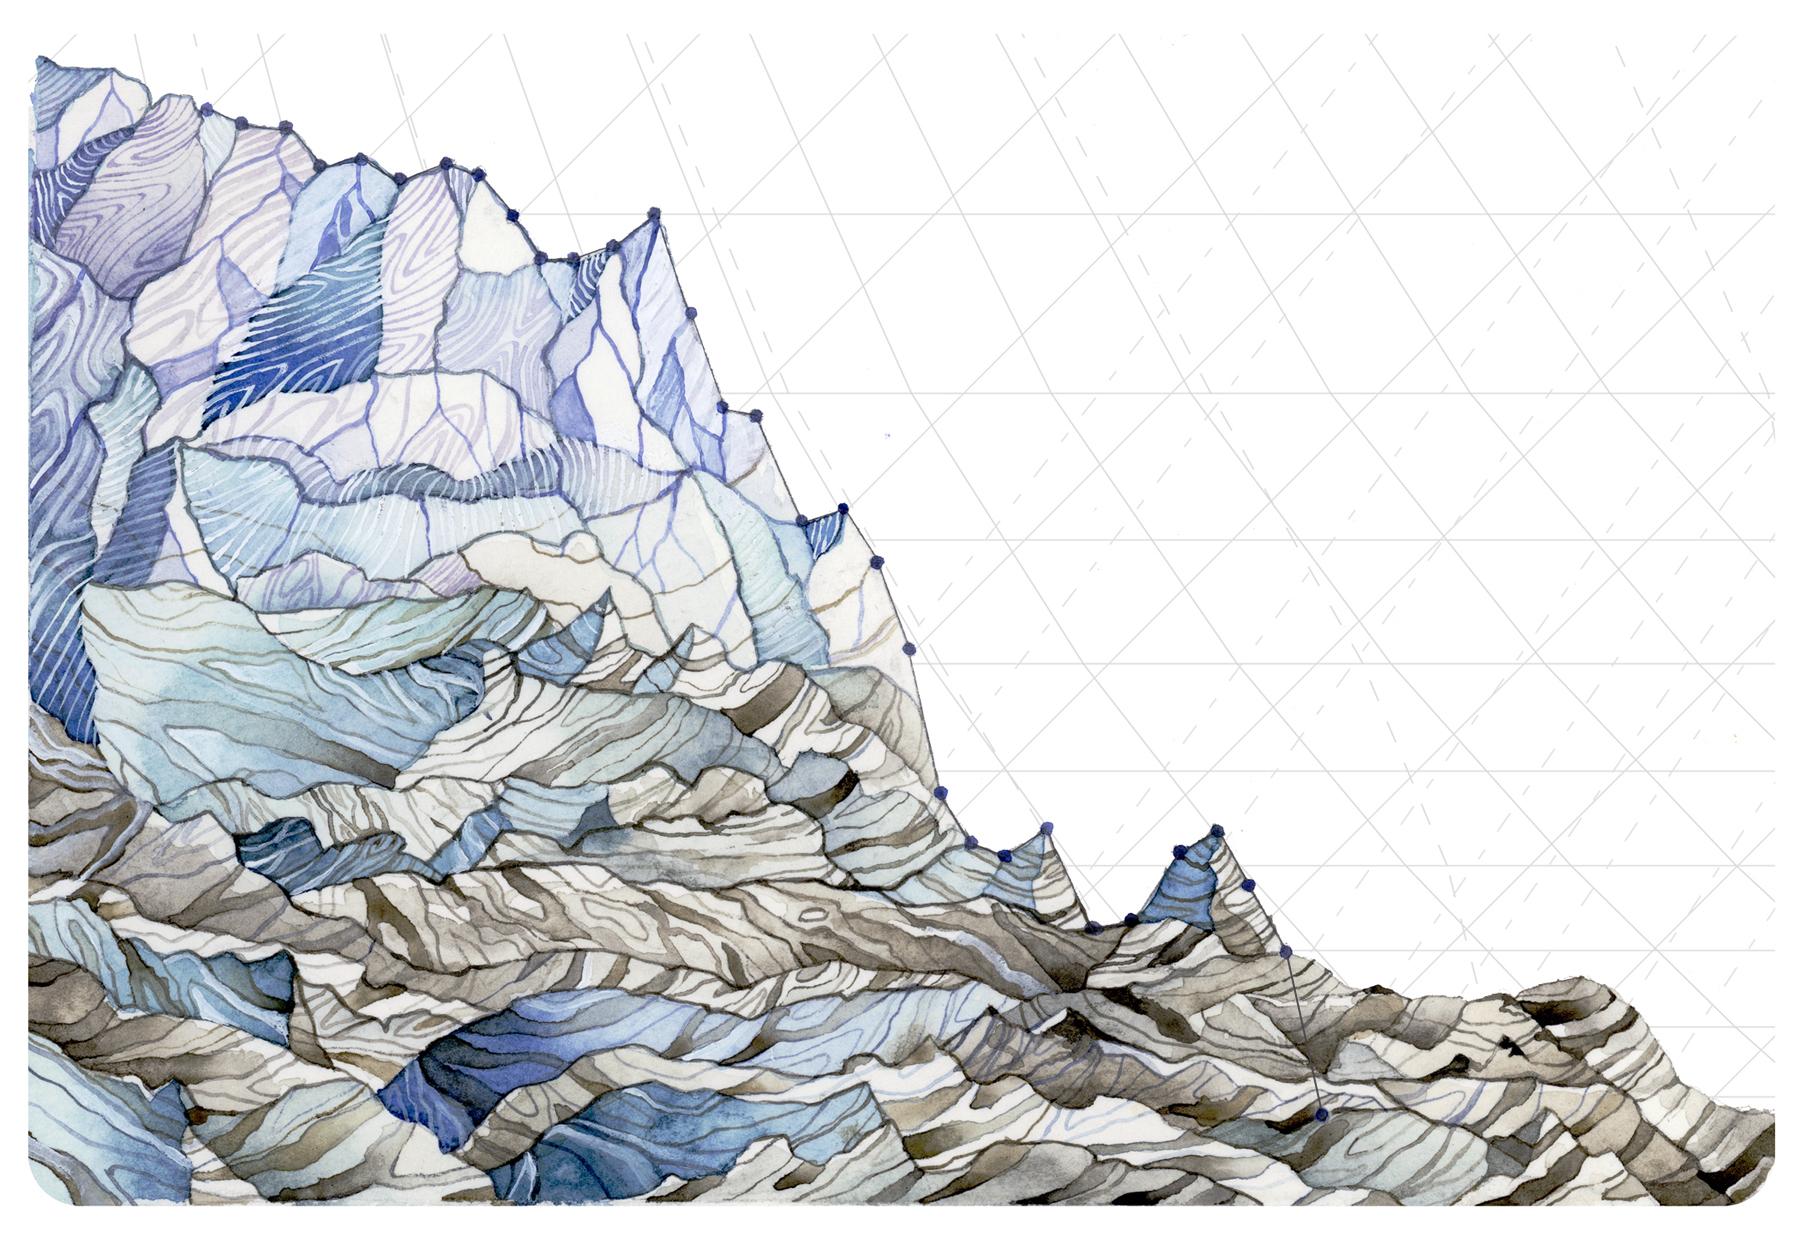
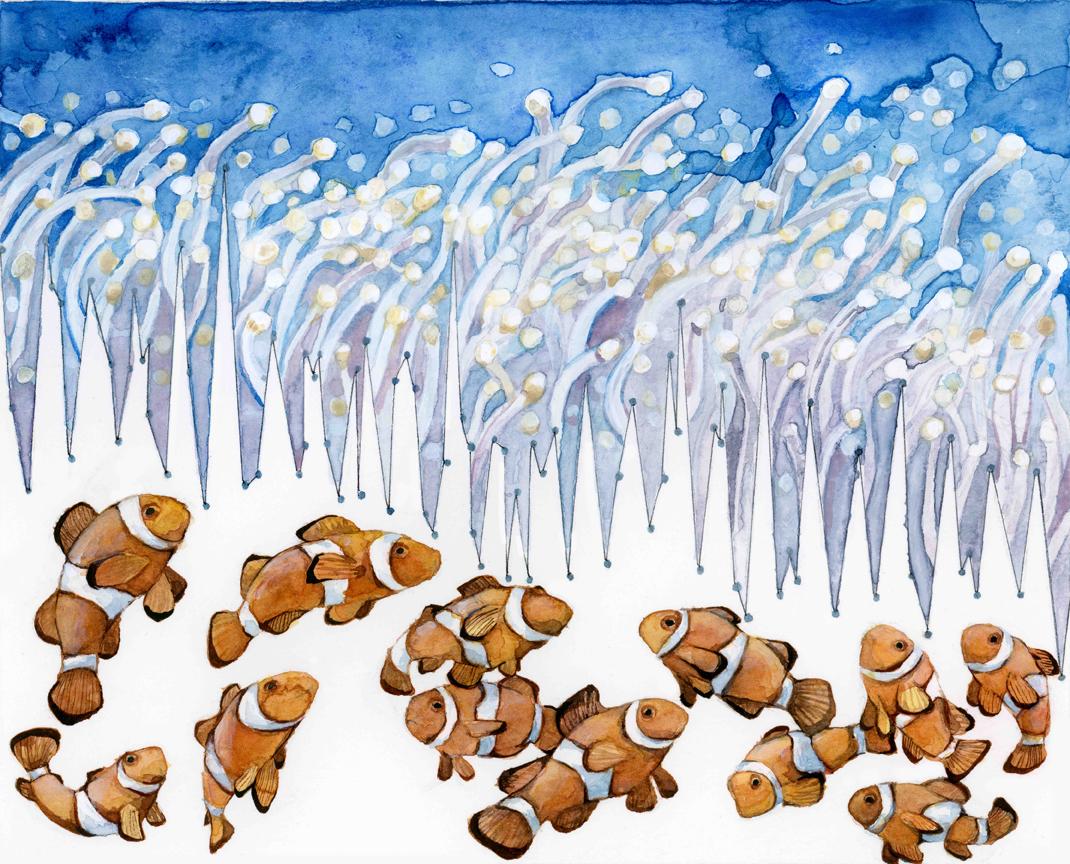
Watercolor? Look closer. It’s a climate change graph!
“Habitat Degradation: Ocean Acidification” contains ocean pH data from 1998 to 2012. Research on clownfish has shown that more acidic water affects their ability to detect the chemical signals that they used to find their way home.
Jill Pelto’s watercolor paintings are vivid portrayals of beautiful landscapes and wildlife. But a closer look reveals scientific data underlying the art, in subtle line graphs that convey information about the earth’s changing climate.
Pelto, a Maine-based artist planning to begin a master’s degree this fall at the University of Maine, with a focus on glacial geology and paleoclimate studies, had long been searching for ways to merge her interests in art and earth science. Inspiration hit last summer upon a routine field research trip to Washington State with the North Cascade Glacier Climate Project, which her father, a glaciologist, founded in 1983. Pelto has been volunteering on these trips since she was in high school, and says that environmental changes to the area were particularly noticeable this past summer.
“Because of the drought, it was just really devastating throughout the area,” Pelto says. Glaciers had retreated, reservoirs were depleted, and she could see smoke in the sky from ongoing forest fires. “That really was sad because when you go back to an area again and again, you form a relationship with it. It’s such a beautiful area.”
Data collected during these trips support what she has witnessed. For instance, the annual glacier mass balance in the North Cascades has been declining over the past 30 years, meaning that more ice is being lost than is accumulating. “And this past summer showed a particularly steep drop from the previous year,” says Pelto.
Pelto decided to incorporate data like these into her art. “I always am looking at graphs and thinking about how much they represent, but I realized that most people don’t pay attention to graphs [in the same way],” she says. Pairing the numbers and figures with watercolors could help people see climate change information in a fresh way, she thought.
“Habitat Degradation: Ocean Acidification,” pictured at the top of this post, contains ocean pH data from 1998 to 2012. The overall decline in pH is due to atmospheric carbon dioxide dissolving in the ocean, which reacts with water to make carbonic acid, which subsequently contributes to ocean acidity. Research on clownfish has shown that more acidic water affects their ability to detect the chemical signals that they used to find their way home. The clownfish in Pelto’s watercolor are illustrated in a state of confusion, separated from the anemone in which they live.
Pelto has continued making other paintings depicting environmental changes — such as increasing ocean acidity and rising global temperatures — using data from Climate Central, NOAA, NASA, and her father’s field research, among other sources.
So far, Pelto has received positive feedback from scientists, activists, and non-scientists alike. “That’s sort of the main goal for me—to reach a broader audience and to have people become inspired or become educated in small ways from my work,” she says. She’s already working with other scientists to portray their research in similarly imaginative ways.

We want to hear your feedback so we can keep improving our website, theworld.org. Please fill out this quick survey and let us know your thoughts (your answers will be anonymous). Thanks for your time!
