5 stories to make you smile and think
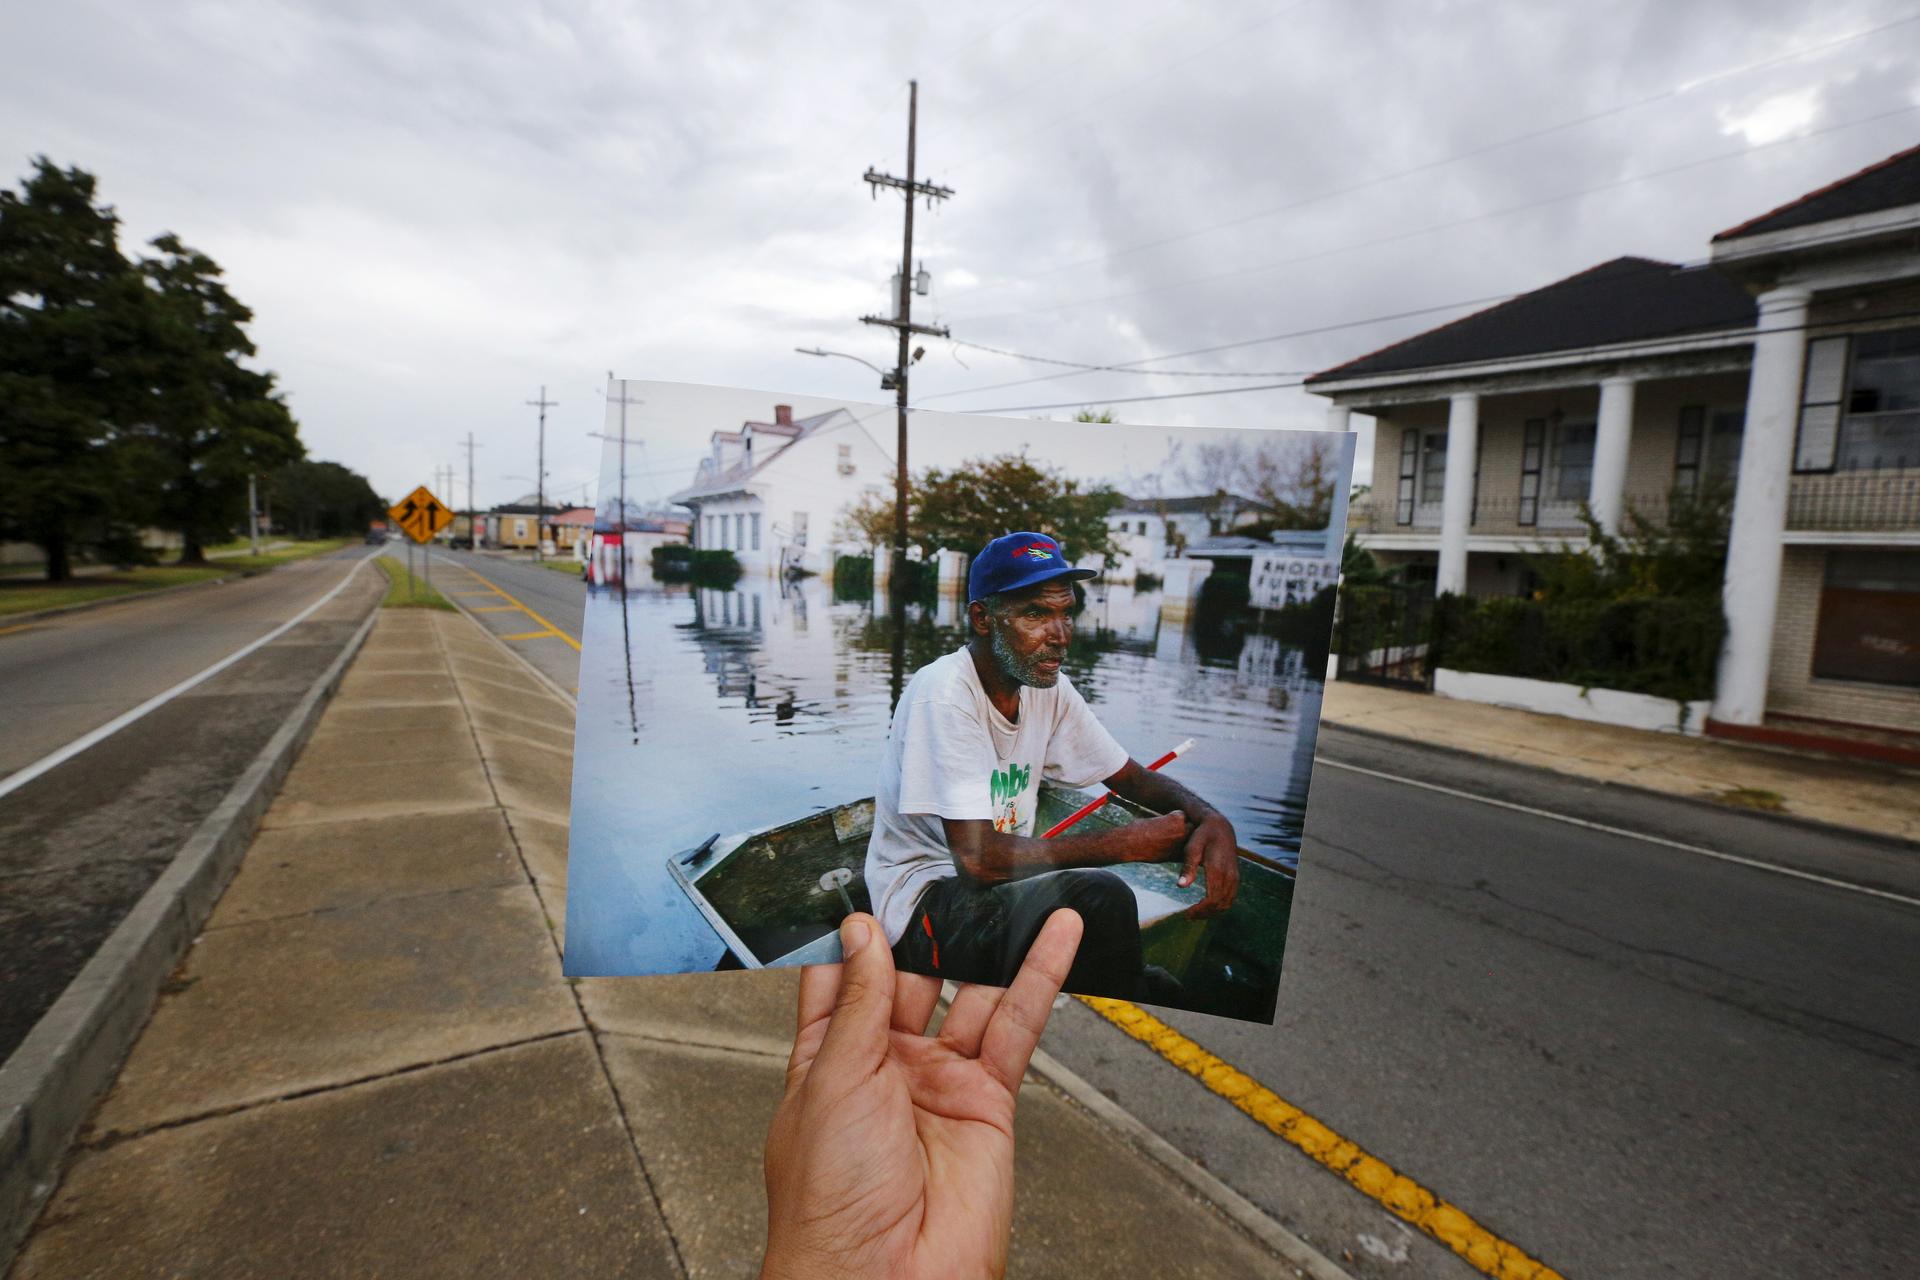
Photographer Carlos Barria holds a print of a photograph he took in 2005, as he matches it up at the same location 10 years on, in New Orleans. The print shows Errol Morning sitting on his boat on a flooded street September 5, 2005, after Hurricane Katrina struck.
1. Old photos, new context: Artist colorizes, creates magic from discards

Before and after. We know now that America's East and Gulf Coasts will be flooding more in upcoming years because of climate change. But how much? And how do you show that in a way that people can understand? On the 10th anniversary of the Katrina disaster here's how much more often these American cities will be flooded. That's what we're trying to do, with Vanilla Ice, in this data visualization app.
Please forward this newsletter to those who would find it interesting. If you're not getting it daily, it’s easy to subscribe. Sign up today.